
With support from the Keasbey Memorial Foundation as their 2013-14 Keasbey Fellow, I pursued my interest in academic research through an M.Phil degree in Forest Ecology and Conservation at the University of Cambridge. I joined the Plant Sciences Department’s Remote Sensing for Forest Conservation group, led by Dr. David Coomes, and conducted research that aimed to clarify the relationship between deforestation and ecosystem health in tropical forest protected areas through the application of emerging remote sensing technologies.
My Master’s research involved processing and analyzing hundreds of satellite images of the planet to identify what they were telling us about the historic and current state of tropical forests globally. Here’s an example of one methodological sequence I used to process and analyze the satellite imagery:
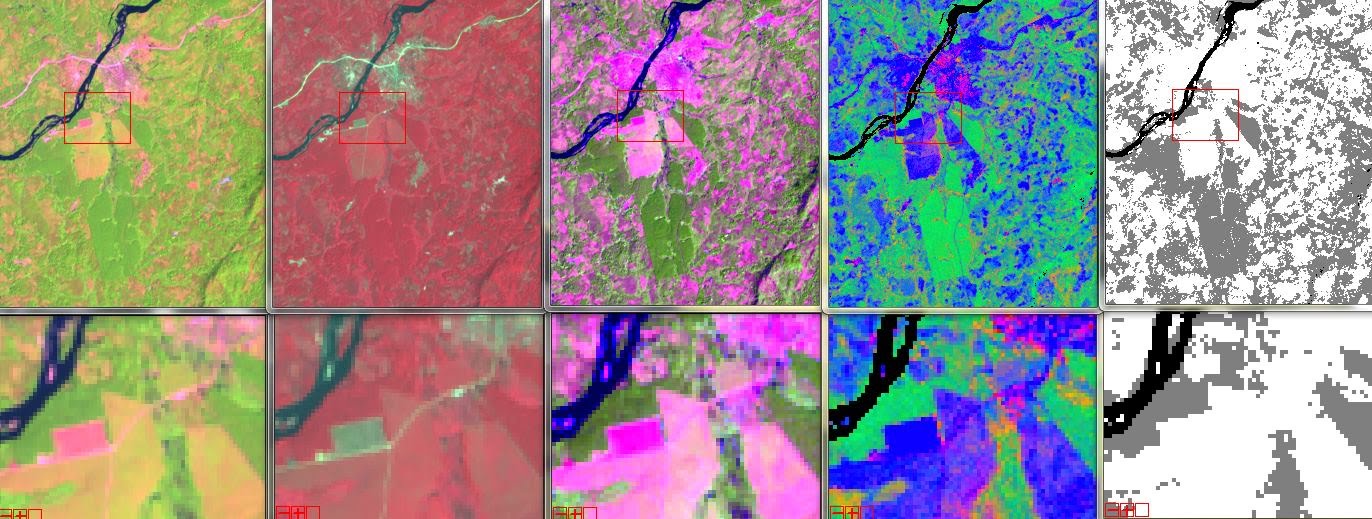
On the far left, you see a raw satellite image (read: a collection of pixels, each of which holds information about the amount of electromagnetic radiation reflected from the Earth’s surface) of an oil palm plantation in Sierra Leone. (To the right of the raw image is a red-green false color image, just for some fun!) In the raw image, you can already paint an intuitive picture of the landscape: a river (midnight blue) cutting through a settlement and a road (both depicted in pink-ish hues) surrounded by largely vegetated landscape (green). Our task was to attach semantics to these pixels by attributing each pixel (each of which represents a 30 meter x 30 meter area) to a specific land use/cover type. More specifically, our challenge was to convert this image into a more decision-useful image that would tell us which pixels represented real forest vs. non-forested area on the ground.
Here was our basic analytical process: run the raw imagery (far left) through a series of processes (a subset of which you see above in the 3rd and 4th column sets from the left) that apply algorithms to classify the image pixels into progressively specific, desired land-cover types. For example, in the above 4th column set from the left, blue = non-photosynthetic vegetation, green = photosynthetic vegetation , pink = bare substrate (e.g. roads). We then apply additional algorithms to further classify the pixels into “forest” (gray) and “non-forest” (white) on the far right, and repeat this process on images taken of the same area but from different time periods to determine how the land in the area has changed over time.
I produced two peer-reviewed papers from my research results. You can find the abstracts and links to the full papers immediately below.
Lui, G.V. and D.A. Coomes. 2015. A Comparison of Novel Optical Remote Sensing-Based Technologies for Forest-Cover/Change Monitoring. Remote Sensing 7(3): 2781-2807.
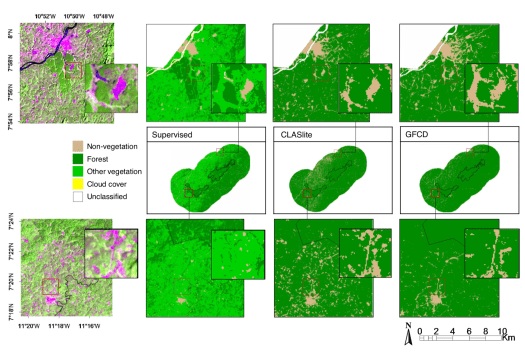
Abstract: Remote sensing is gaining considerable traction in forest monitoring efforts, with the Carnegie Landsat Analysis System lite (CLASlite) software package and the Global Forest Change dataset (GFCD) being two of the most recently developed optical remote sensing-based tools for analysing forest cover and change. Due to the relatively nascent state of these technologies, their abilities to classify land cover and monitor forest dynamics have yet to be evaluated against more established approaches. Here, we compared maps of forest cover and change produced by the more traditional supervised classification approach with those produced by CLASlite and the GFCD, working with imagery collected over Sierra Leone, West Africa. CLASlite maps of forest change from 2001–2007 and 2007–2014 exhibited the highest overall accuracies (79.1% and 89.6%, respectively) and, importantly, the greatest capacity to discriminate natural from planted mature forest growth. CLASlite’s comparative advantage likely derived from its more robust sub-pixel classification logic and numerous user-defined parameters, which resulted in classified products with greater site relevance than those of the two other classification approaches. In light of today’s continuously growing body of analytical toolsets for remotely sensed data, our study importantly elucidates the ways in which methodological processes and limitations inherent in certain classification tools can impact the maps they are capable of producing, and demonstrates the need to understand and weigh such factors before any one tool is selected for a given application.
Lui, G.V. and D.A. Coomes. 2016. Tropical nature reserves are losing their buffer zones, but leakage is not to blame. Environmental Research 147: 580-589
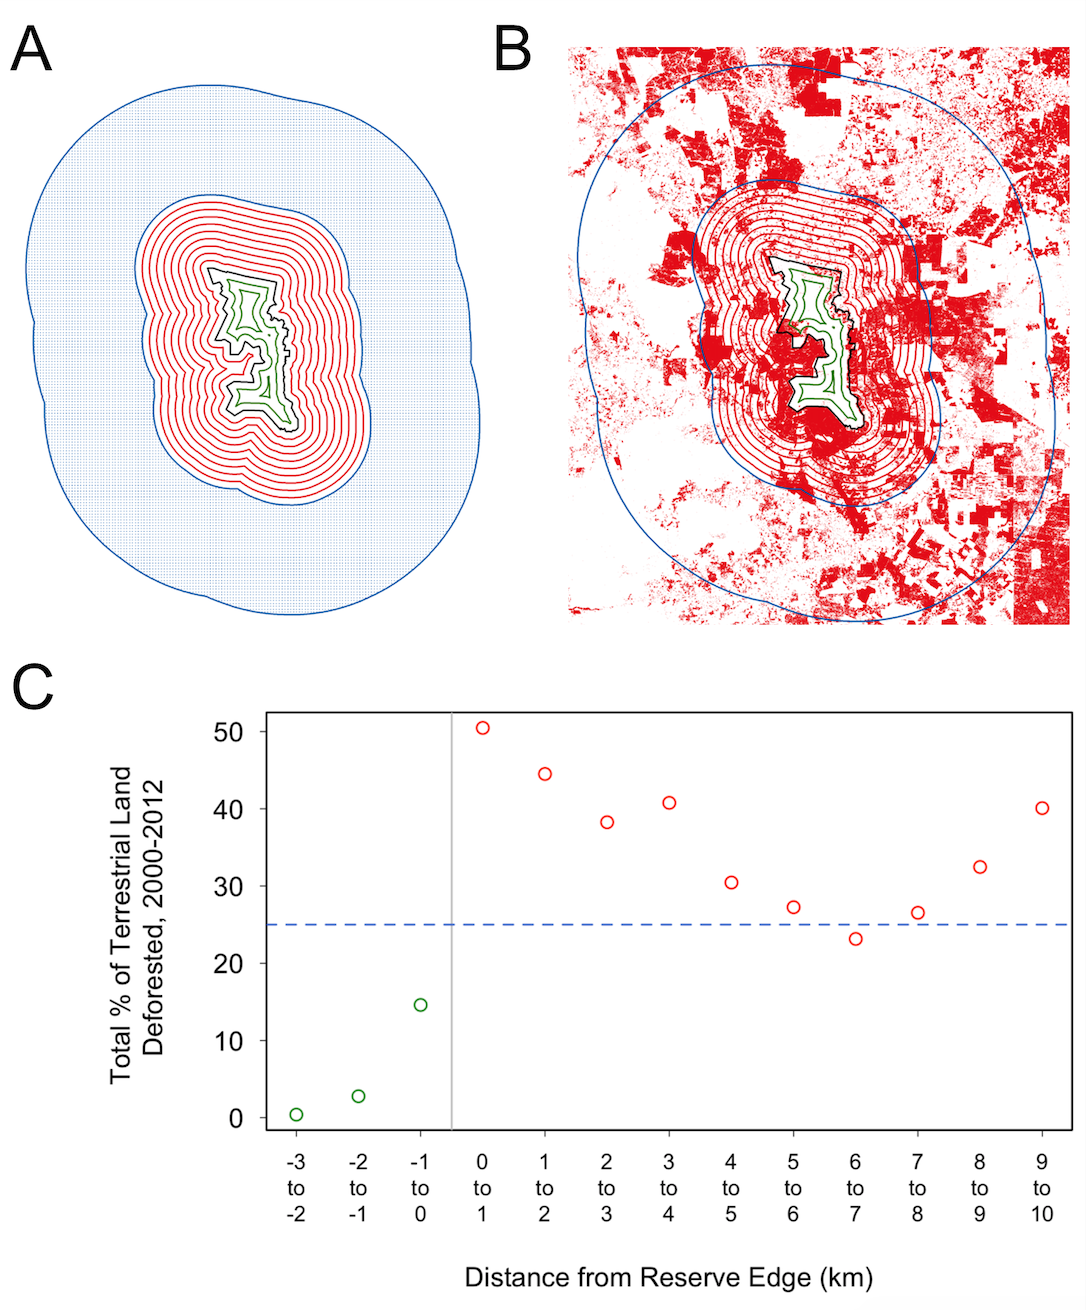
Abstract: Tropical forests provide important ecosystem services to humanity, yet are threatened by habitat loss resulting from deforestation and land-use change. Although reserves are considered the cornerstones of conservation efforts in the tropics, their efficacy remains equivocal. One question that remains unresolved is whether leakage – the unanticipated displacement of deforestation from inside reserves into the unrestricted zones just beyond a reserve’s administrative boundary – is common around tropical forest reserves, or whether the zones are acting as buffers between the protected area and the outside world. To resolve this question, we used the Landsat-derived Global Forest Change dataset to estimate deforestation rates between 2000 and 2012 inside and outside of 60 nature reserves spread across the tropics. Deforestation rates inside reserves (within 5 km of the administrative boundary) were generally lower than those immediately outside the reserves (i.e. in buffer zones 0–10 km from the boundary), suggesting that reserves are effective at protecting forests. We hypothesised that leakage would result in greater deforestation rates in reserve buffer zones than in the broader reserve landscapes, but such a pattern was observed in only five African sites, suggesting that leakage does not often occur on the edge of established reserves. However, roughly 80% of reserves experienced deforestation rates that increased gradually from their interiors to the outer periphery of their buffer zones. Thus, while leakage may not be a pervasive phenomenon around tropical reserves worldwide, tropical reserves are often losing their buffer zones, resulting in increased isolation that could have ramifications for ecosystem services provisioning and tropical conservation strategies.
